k = Ae-(Ea/RT)
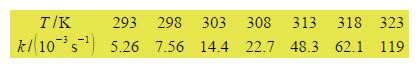
Firstly, using the following experimental data for the rate constants and temperatures draw a graph of ln(k/s-1) versus (1/T) x (103 K) the reciprocal of the pure number obtained by dividing the temperature by its unit kelvin. Secondly, determine the values of A and Ea for this reaction. Thirdly, use the equation of the line from the graph to calculate the rate constants at 283 K (do not extrapolate the graph).
Here,
Arrhenius plot temperature data.
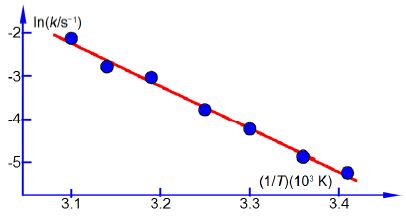
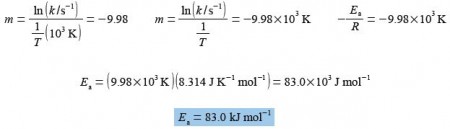
In above Figure the Arrhenius plot is a straight line. From a full-sized manually-drawn version of Figure I obtained y = -9.98x + 28.7. The Arrhenius equation has a gradient m = -E,/R where R is the gas constant and Ea is the activation energy. So from the gradient we obtain the activation energy Ea we must also remember to indude the units and their multiples of the axes in the calculation.
The equation of the straight line in above figure has an intercept of c = 28.7 which for the Arrhenius equation is equal to c = In(A). The intercept is on the y-axis and so the intercept will have the same units and any multiples there happens to be as the y-axis.
c = ln (A/s-1) = 28.7; A/s-1 = 2.91 x 10¹²
A = 2.91 x 10¹² s-1
To calculate the rate constant at: T= 283 K then (1/7) = (3.5336 x 10⁻³ K-1) and so x = (3.5336 x 10⁻³ K-1) using the equation for the best line we can then calculate the corresponding value for y = ln (k/s-1).
In (k/s-1) = (-9.98 x 10³ K) (3.5336 x 10⁻³ K-1) + 28.7 = — 6.37 k
K = 1.40 x 10⁻³ s-1