Straight line graphs are important in science and are very common. Linear graphs are particularly useful as being strong evidence that the Maths really does model the Chemistry, they are much easier to use in this way than curved graphs. They also allow you to spot any “rogue” or outlying experimental data points. A linear equation is of the form.
y=mx+c
Where x and y are the variables, m is the gradient of the line (how quickly y increases, or decreases, as x is increased), and c is the intercept on the y-axis (the “offset” that y starts with when x = 0) as in below Figure (the data points are not shown for clarity).
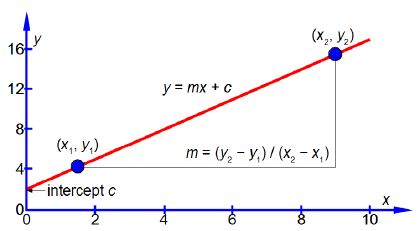
The vertical axis is the y-axis and the horizontal axis is the x-axis. Whatever the names that are used for the variables in a particular situation, we should always say “plotting y against x” or “plotting y versus x” where the variable names are used instead ofy and x. Once you have used your judgement to draw the best straight line (e.g. using a transparent ruler) then the equation of the best straight line is found as follows. Using the line itself not the data points, otherwise what was the point of drawing a best straight line, pick two positions on the line, one near the left hand side and one near the right hand side, shown in blue in above Figure. They are, respectively, (x1, y1) and (x2, y2) which I have measured from the full-sized hand-drawn graph to be (1.5, 4.25) and (9.0, 15.5). These two points give two simultaneous equations for y = mx + c.
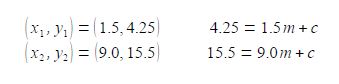
Subtracting the two simultaneous equations gives us the gradient m
11.25 = 7.5 m; m =1.5
and adding the two simultaneous equations and using our value for m from above, we have
19.75 = 1.5 x 10.5 + 2c; c = 2.0
The equation for our straight line is thus
y = 1.5x+2.0
In exams you will need to be able to manually plot a graph on graph paper and find the equation of the line. Computers, phones, and graphic calculators are not allowed, so practice with some of the tutorial questions!
Quite often the data is such that the graph has a very large intercept, not like above Figure, then it is necessary to plot the graph with the intersection of the axes not at the origin (0, 0) but at a more convenient point. Also the scale of the axes must be adjusted so the data points occupy a reasonably large area (about half an A4 page in portrait mode is a useful size). Then the only way to obtain gradients and intercepts is by finding the equation of the line as in the above method.
In Chemistry often the equation that models the chemical behaviour is not a straight line function and then Maths is necessary to rearrange the equation to obtain a linear function that can be plotted as partial evidence that the original model actually agreed with the experimental data. Below Figure has a typical plot of data from a rearranged Arrhenius equation (which we discuss later). Firstly, notice how the axes are labelled as pure numbers.
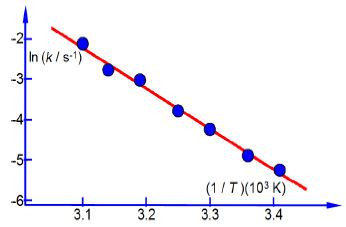
Secondly, note the scales and the intersection of the axes.
Thirdly, and perhaps a little confusing at first sight, is the fact that the x-axis in above second Figure is the reciprocal of temperature (1/T) and it is multiplied and not divided by a numerical factor. A lot of people have problems with this type of reciprocal labelling of axes, so I am going to spent some time going through it step by step. Let us take the temperature T = 300 K as an example for our x-axis labelling.
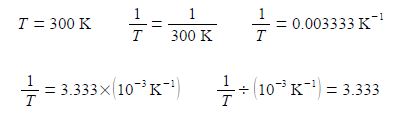
The x-axis could be labelled as in above-right, however, it is more clearly understood and more easily used in later processing of results when written in the following way
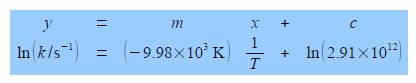
The y-axis label is easier to understand, we take the natural log of the pure number (k/s-1) to give Ln (k/s-1) which is also a pure number. For second Figure the best manual straight line (y = nix c) is y = -9.98x ± 28.7.
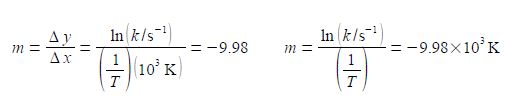
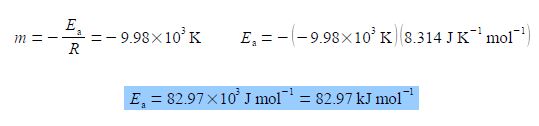
For the Arrhenius equation we will discover that the gradient equals – Ea /R where R is the gas constant and Ea is the activation energy. So from the gradient we can obtain the activation energy Ea.
From the equation of the best straight line for second Figure, the intercept c = 28.7 and because the intercept is defined as where the line meets the y-axis thus the intercept has the same units as the y-axis. From the Arrhenius equation the intercept is equal to c = ln(A).
C = ln (A/S-1) = 28.7; A/S-1 = 2.91 x 10¹² A = 2.91 x 10¹² s-1
Thus equation of the line in second Figure is: