Graphical analysis of beats:
Beats: When two sets of waves of nearly equal frequencies and amplitude are superposed it is found that the amplitude of the resultant wave fluctuates with time from maximum to minimum. This phenomenon of fluctuation amplitude is known as beats.
Graphical analysis:
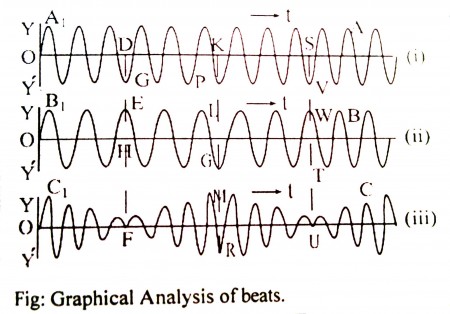
Let AA1 and BB1 re two sound waves of almost equal frequencies and CC1 is the resultant.
In fig (i) and (ii) at D and H waves are opposite phase. So the resultant amplitude at F is almost Zero since the resultant is the algebraic addition of DG and HE.
Again in fig (i) and (ii) at K and L waves are in the same phase. So the resultant amplitude will be MR which is the algebraic addition of KP and LG.
In fig (i) and (ii) at S and T waves are in opposite phase again. So the resultant amplitude at U is almost zero since the resultant is the algebraic addition of SV and TW. So in the time between F and U, the waves complete one vibration i.e. produced one beat. So how many FU will be produced per second, the number of beats will be that numbers. Thus the beats are produced.