The Engle Curve tracks the consumption of a Good X as an individual’s income changes. Income is plotted on the x-axis and the quantity of Good X consumed is the plotted on the y-axis. The curve that follows amount of Good X consumed as income increases plots the Engels Curve.
The slope of the Engle Curve also tells us whether or not the good is a normal good or inferior good. If the slope of the curve is positive, the good is a normal good because consumption increases as income is increased. If the slope of the curve is negative, the good is an inferior good because consumption decreases as income is increased.
The Engel Curve can be derived from the Income Expansion Path. Each budget constraint in the Income Expansion Path provides the income. The amounts of Good X consumed at the points of consumers’ optimum on the budget constraint provide the quantity of Good X consumed at those income levels.
| Income | Quantity Of Good X |
| 100 | 10 |
| 150 | 20 |
| 200 | 30 |
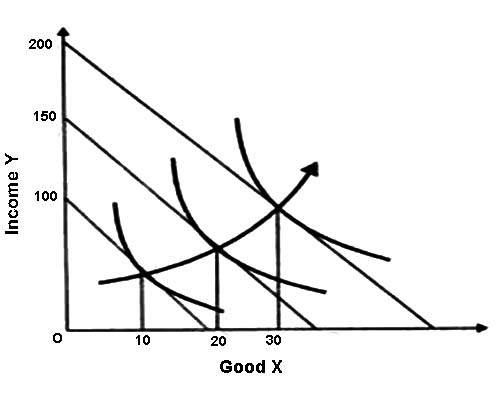
This shows an Income Expansion Path for goods X and Y with four points of consumer’s optimum shown. Good Y is a numeration (priced at 1) and the relevant points for forming an Engel Curve are in the table to the right of the Income Expansion Path.
The information from the Income Expansion Path(IEP) can produce two different Engels Curves, one for Good X and one for Good Y. Each would use the income values provided by the budget constraints, and the variables respective quantity values.