The U-shapes of the average total cost, average variable cost, and marginal cost curves are directly or indirectly the result of increasing marginal returns for small quantities output (production Stage I) followed by decreasing marginal returns for larger quantities of output (production Stage II). The decreasing marginal returns in Stage ll result from the law of diminishing marginal returns.
The U-shaped cost curves form the foundation for the analysis of short-Tun, proms maximizing production by a firm. These three curves can provide all of the information needed about the cost side of a firm’s operation.
Bring on the Curves:
The diagram to the right displays the three U-shaped cost curves- average total cost curve (ATC), average variable cost curve (AVC), and marginal cost curve (MC) for the production.
All three curves presented in this diagram are U-shaped. In particular, the production is guided by increasing marginal returns for relatively small output quantities. then decreasing marginal returns for larger quantities.
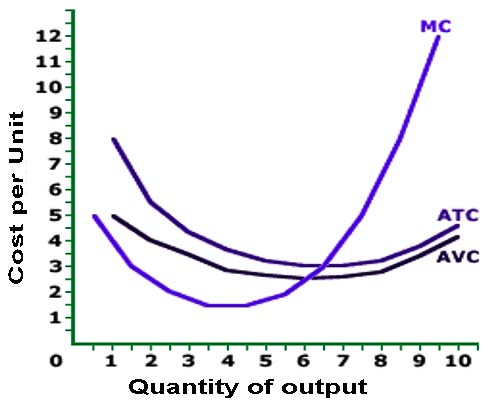
Consider a few reference points:
- The marginal cost curve reaches its minimum value at 4 units.
- The average variable cost curve reaches – its minimum at 6 units.
- The average total cost curve reaches its minimum at 6.5 units.
The marginal cost curve is the only one of these three curves that is directly affected by the law of diminishing marginal returns. Up to a production of 4 unit, increasing marginal returns is in effect. From the 5th unit on, decreasing marginal returns (and the law of diminishing marginal returns) takes over The U-shaped pattern for the marginal cost curve that results from increasing and decreasing marginal returns is then indirectly responsible for creating the U-shape of the average variable cost average total cost curves,