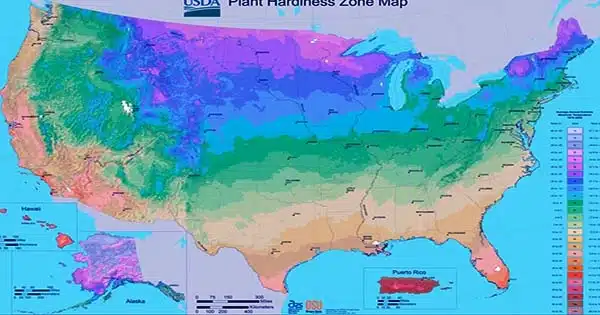
The United States Department of Agriculture today issued its updated Plant Hardiness Zone Map, the national standard for determining which plants are most likely to survive the coldest winter temperatures in a given location.
The USDA touts the most recent map, created in collaboration between Oregon State University’s PRISM Climate Group and the USDA’s Agricultural Research Service, as the most accurate and detailed it has ever issued.
PRISM is an acronym for Parameter-elevation Regressions on Independent Slopes Model, which is part of the OSU College of Engineering. The previous edition of the plant hardiness map was issued in January 2012, and it was also based on PRISM data. The updated plant hardiness map comprises data from 13,412 weather stations, up from 7,983 in the 2012 edition.
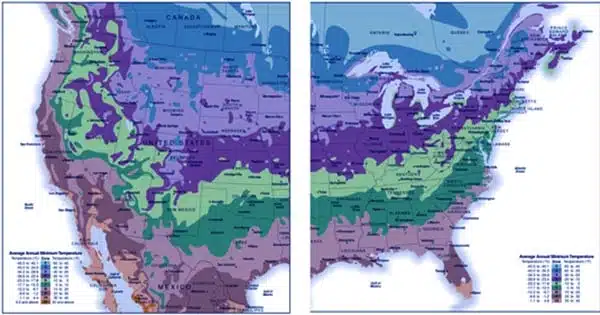
The map, which is viewable in an interactive Geographic Information System format, is based on 30-year averages (1991 to 2020) for the lowest annual winter temperatures within selected regions. The averages from 1976 to 2005 were used in the 2012 edition.
Low winter temperatures are critical for the survival of plants in some regions. In December 2021, the latest edition of PRISM’s main product, the 30-year climatic normals, was issued. Every ten years, PRISM publishes new climate normals, removing one decade’s worth of data and replacing it with another.
“The addition of many new stations and more sophisticated mapping techniques using the latest PRISM technology resulted in a more accurate and detailed Plant Hardiness Zone Map, but it also produced localized changes that are not climate-related,” said Christopher Daly, director of the PRISM Climate Group and lead author of the map.
The plant hardiness map is divided into 13 zones, each indicating a 10-degree Fahrenheit temperature range. Each zone is further subdivided into two half zones, each having a 5-degree range.
“Overall, the 2023 map is about 2.5 degrees warmer than the 2012 map across the conterminous United States,” according to Daly. “As a result, roughly half of the country moved to a warmer 5-degree half zone, while the other half remained in the same half zone.” The middle plains and Midwest warmed the greatest, whereas the southern United States warmed the least.”
The new map is accompanied by a “Tips for Growers” feature that provides information on Agricultural Research Service projects that gardeners and others who produce and breed plants may be interested in.
According to the USDA, the most frequent map users are the nearly 80 million American gardeners and producers. Furthermore, the USDA Risk Management Agency utilizes the map to define crop insurance regulations, and scientists include plant hardiness regions in research models, such as those studying the spread of exotic weeds and insects.v