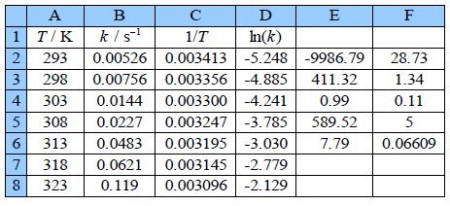
Question: Figure shows the experimental data from a student lab experiment to measure the first-order rate constant of a chemical reaction against temperature.
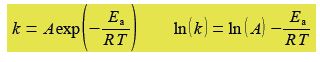
The Arrhenius equation can be transformed into a linear equation by taking logs on both sides and plotting the linear equation ln(A) against 1/T, this transformed graph is called an Arrhenius plot.
The intercept of the Arrhenius plot is c = In(A) and the gradient m = -Es/R. Type up your own spreadsheet, transform the data and find the pre-exponential factor A and the activation energy; and their precisions. Do you notice anything worrying about your LLSQ fitted line when you graph it?
Solution
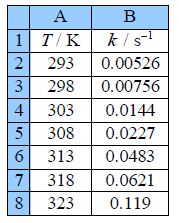
Type up your own spreadsheet of the T, k, 1/T and In(k) in columns A, B, C and D. Use LINEST to give a spreadsheet similar to below figure.
The LINEST fit to the plot of the log from of the Arrhenius equation is:
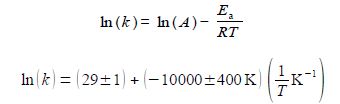
From the intercept the pre-exponential factor A is found by taking the anti-log, i.e. exp(29 ± 1). I have used some extra decimal places to reduce any rounding errors. As it is an exponential scale the error limits are not symmetrical around the mean value. The pre-exponential factor from our LLSQ fitted experimental data is,
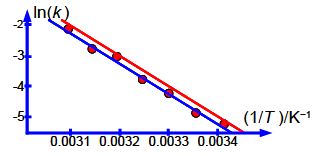
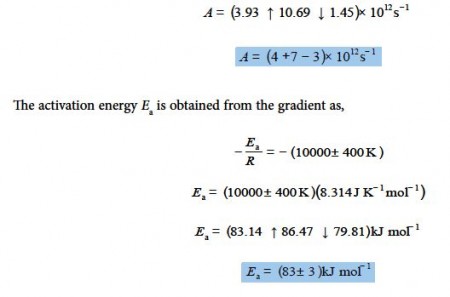 The relative errors of the pre-exponential factor are between +175% and —75% and so extrapolation should be avoided. However, the relative error of the activation energy is fairly small at 4%. Below Figure shows the Arrhenius plot and the LLSQ fitted equation in red.