A flowchart is a type of diagram that represents an algorithm, workflow, or process, showing the steps as boxes of various kinds, and their order by connecting them with arrows. This diagrammatic representation illustrates a solution model to a given problem. Flowcharts are used in analyzing, designing, documenting or managing a process or program in various fields. The purpose is to provide people with a common language or reference point when dealing with a project or process. One of the major benefits for an auditor in using a flowchart is the ability to show transitions with information in a clear and concise format.
When to Use a Flowchart
- To develop an understanding of how a process is done.
- To study a process for improvement.
- To communicate to others how a process is done.
- When better communication is needed between people involved in the same process.
- To document a process.
- When planning a project.
A flowchart is a formalized graphic representation of a logic sequence, work or manufacturing process, organization chart, or similar formalized structure. It is a powerful business tool. With proper design and construction, it communicates the steps in a process very effectively and efficiently. Flowcharts use simple geometric symbols and arrows to define relationships.
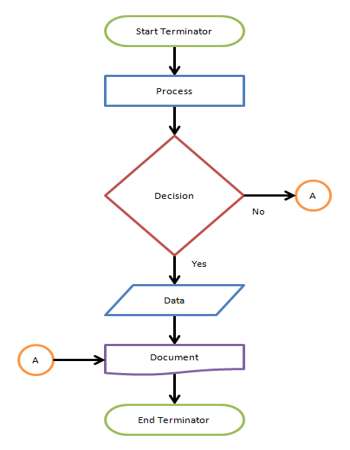
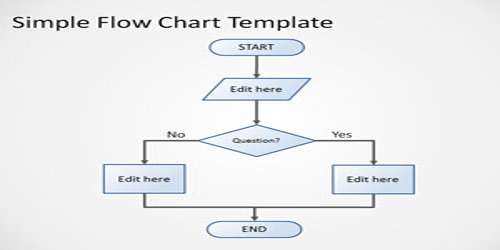
Fig: Flowchart Sample
The most common flowchart symbols are:
- Terminator: An oval flowchart shape indicating the start or end of the process.
- Process: A rectangular flowchart shape indicating a normal process flow step.
- Decision: A diamond flowchart shape indication a branch in the process flow.
- Connector: A small, labeled, circular flow chart shape used to indicate a jump in the process flow. (Shown as the circle with the letter “A”, below.)
- Data: A parallelogram that indicates data input or output (I/O) for a process.
- Document: Used to indicate a document or report