In Statistics, a graphical representation is a visual display of data in the form of a diagram or graph. A chart is a graphical representation of data, in which “the data is represented by symbols, such as bars in a bar chart, lines in a line chart, or slices in a pie chart”. It represents the set of data in a meaningful way. It provides data where it helps to take decisions in a much better way. Some of the various types of graphical representation include – Line Graphs, Bar Graphs, Histograms, etc.
Importance
The purpose of a graph is a rapid visualization of a data set. Graphic visual representation of information is a crucial component in understanding and identifying patterns and trends in the ever-increasing flow of data. It encompasses a wide range of techniques to clarify, interpret, and analyze the data by drawing line segments or by plotting the points in the graphs. Graphical representation of reports has various advantages which follow:
- Acceptability:
Such a report is acceptable to busy persons because it easily highlights the theme of the report. This helps to avoid wastage of film.
- Comparative Analysis:
Information can be compared to interns of graphic representation. Graphical representation enables the quick analysis of large amounts of data at one time and can aid in making predictions and informed decisions. Such comparative analysis helps for quick understand and attention.
- Less cost:
Information if descriptive involves huge time to present properly. It involves more mono to print the information but the graphical presentation can be made in a short but catchy view to make the report followable. It obviously involves less cost.
- Decision Making:
Business executives can view the graphs at a glance and can make-decision very quickly which is hardly possible through the descriptive report.
- Logical Ideas:
If tables, design, and graphs are used to represent information then a logical sequence is created to clear the idea of the audience.
- Helpful for less literate Audience:
Less literate or illiterate people can understand graphical representation easily because it does not involve going through line by line of any descriptive report.
- Less Effort and Time:
To present any table, design, image, or graphs require less effort and time. Furthermore, such a presentation makes a quick understanding of the information.
- Less Error and Mistakes:
Qualitative or informative or descriptive reports involve errors or mistakes. As graphical representations are exhibited through numerical figures, tables, or graphs, it usually involves less error and mistake.
- A complete Idea:
Such representation creates a clear and complete idea in the mind of the audience. Reading a hundred pages may not give any scope to make a decision. But an instant view or looking at a glance obviously makes an impression in the mind of the audience regarding the topic or subject.
- Use on the Notice Board:
Such representation can be hanged on the notice board to quickly raise the attention of employees in any organization. It also makes collaboration significantly more efficient by using familiar visual metaphors to illustrate relationships and highlight meaning, eliminating complex, long-winded explanations of an otherwise chaotic-looking array of figures.
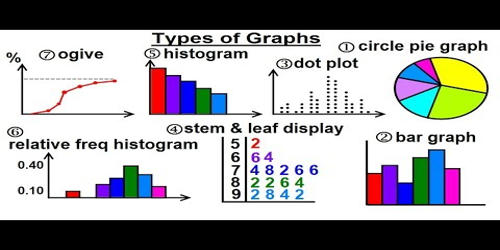
There are different types of graphical representation. Some common of them are as follows:
- Line Graphs – Linear graphs are used to present the continuous data and it is helpful for predicting future events over time.
- Bar Graphs – Bar Graph is used to display the category of data and it compares the data using solid bars to represent the quantities.
- Histograms – The graph that uses bars to represent the frequency of numerical data that are organized into intervals.
- Frequency Table – The table shows the number of pieces of data that falls within the given interval.
- Circle Graph – Also known as a pie chart that shows the relationships of the parts of the whole.