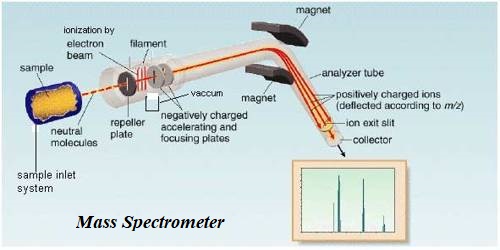
Applications of mass spectrometry
The mass spectrometer was devised by F.W. Aston (1813) and was first applied in the determination of isotopic masses and the relative abundances of isotopes. It is an analytical technique that ionizes chemical species and sorts the ions based on their mass-to-charge ratio.
Mass spectrometry is used in many different fields and is applied to pure samples as well as complex mixtures. The technique has found wide application in the determination of molecular masses of compounds and elucidation of their structures.
A mass spectrometric analysis of a monatomic element reveals the isotopic composition of the element. When calibrated using 12C isotope the relative isotopic masses can be read directly from the stick diagram. Such analysis shows that Neon has three isotopes, 20Ne, 21Ne and 22Ne with relative abundances in the ratio 114 : 0.2 : 11.1. This is shown in the form of a stick diagram in Figure.
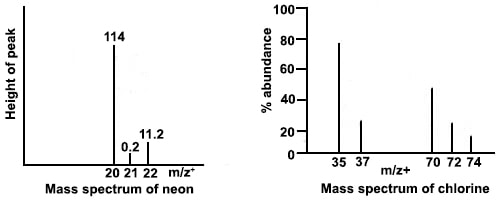
A mass spectrum given in Figure shows that there are two isotopes of chlorine 35Cl and 37Cl and three types of chlorine molecules, 35Cl35Cl, 37Cl37Cl, 37Cl37Cl.
When a compound is investigated in the mass spectrometer one can obtain the peak for the molecular ion, which is the ion formed when an electron is knocked out of the molecule, and singly charged fragments into which the molecules may be broken into. Sometimes the molecular ion may be so unstable as to break up ink, fragments in which case the molecular ion may not be detected. As an example, the mass spectrum of CH3CH2OH shown in Figure may be considered. It slows peaks at m/z+ values of 15, 29, 31, 45, 46. The molecular mass of the compound is 46. Hence the peak at 46 must be for the molecular ion CH3CH2OH+. The other peaks may be attributed to the presence of the ions CH3+, C2H5+, CH2OH+, CH3CH2O+ respectively.
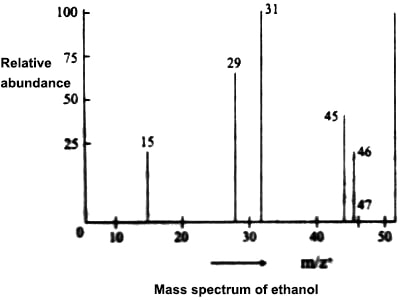
Figure: Fragmentation of the ethanol molecule.
Masses of the fragments yield valuable information about the structure of the molecule. For example, it is possible to differentiate between propanaldehyde and acetone. Propane-aldehyde gives peaks at 48, 43 and 29 whereas acetone gives peaks at 48, 43 and 28.