The simplest spectra to study are those of H, as it only has one electron. These contain sets of lines which can be related to the energy levels. The Lyman series (in the ultra-violet) correspond to transitions to or from the ground state, i.e. n=1.
Balmer series
A second set of lines, in the visible region are called the Balmer series. They correspond to transitions involving excitation from the second energy level, n=2. Further series correspond to transitions involving higher energy shells.
Energy Level Diagram
The diagram shows transitions between energy levels. An electron moves up from one energy level to another when it absorbs a particular wavelength. An electron moves down from one energy level to another when it emits a particular wavelength.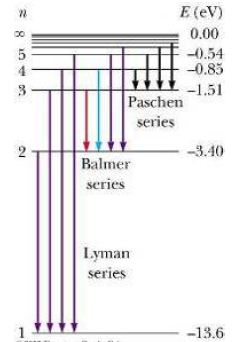
Interpreting electronic spectra: Careful study of absorption or emission spectra reveals the permitted electronic energy levels within an atom. The amount of energy needed to remove an electron completely from an atom is called the ionisation energy. This is equivalent to an electron in the ground state absorbing enough energy to move up to the infinite energy level.