Rate of the Reaction: Explanation
More important and useful is the determination of the rate at a particular time after the start of the reaction. Suppose one wants to find the rate 50 seconds after the start of the reaction.
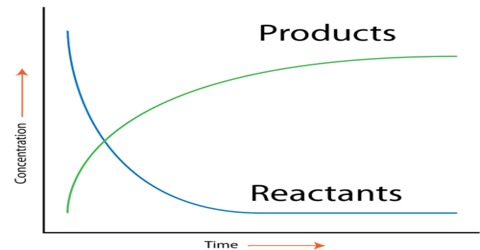
Obviously the above data will not give the information. A graphical method is to be used for the purpose. If the concentration of A is determined at different times after the start of the reaction the data can be represented in the form of a graph as shown in Figure 1. Similarly if the concentration of the product B is determined at different times after the start of the reaction the data will be represented by a graph as shown in Figure 2.
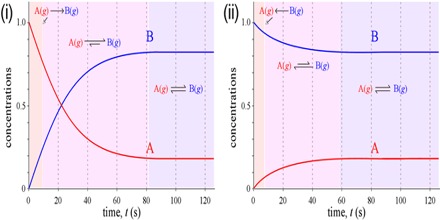
Fig:1: Concentration of A vs Time; (2)Concentration of B vs Time
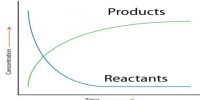
The rate of the reaction at any time can be determined by drawing a tangent to the curve at that particular time and finding the gradient (slope) of the curve as shown in Figure 3. The slope of the tangent is the rate of the reaction at that particular time. The slopes of the tangents drawn at different times on the curve become smaller with increase of time indicating that the rate decreases as the reaction proceeds. These rates are what are called instantaneous rates, that is, the rates at particular instants.
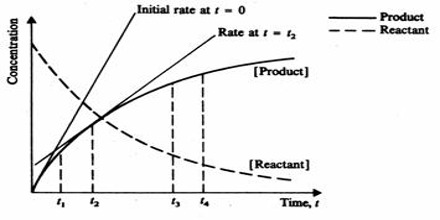
Fig: Concentration of reactant and Product vs Time
When we measure the change of concentration ∆A over a period of time ∆t the rate as written is the average rate over the period of time. This must be because the rate is changing every instant as the nature of the curves (Figure 1 and 2) show.
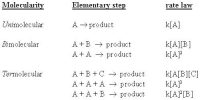
For a reaction such as, A + 2B = 3C + D, one can write the rates as:
Rate = ∆[A] / ∆t = – ½ {∆[B] / ∆t} = 1/3 {∆[C] / ∆t} = ∆[D] / ∆t
Since the concentrations of the products are increasing the last two terms are positive. One should note that the rate of decrease of concentration of A is equal to half the rate of decrease of concentration of B as when one mole of A reacts two moles of B react.