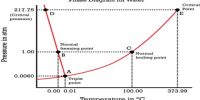
In two component systems we will consider solid—liquid and liquid—liquid systems. The systems will be treated separately as they are distinct from one another in certain respects. The maximum number of phases that can co-exist in such systems is four (0 = 2 – P + 2 or P = 4).
Solid-liquid Equilibria: Eutectic Poin
Here consider two types of solid-liquid systems-
(1) Two component systems that do not form compound
(2) Two component systems that form compound
In a two component system there could be two solid, one liquid and a vapour phase, provided that in the liquid (molten) phase the components and the compound, if formed, are completely miscible in all proportions. In many two component systems the vapour phase will be neglected as the pressure of the vapour is very small. In these cases the phase rule is simplified to F = C – P + 1. Such systems are called condensed systems. When there are three phases co-existing F = 0, i.e., a triple point will be reached. When there are two phases in equilibrium, F = 1 and when only one phase is present F =2.
The two pure components are completely miscible with each other in the liquid state and there is no chemical interaction between them.
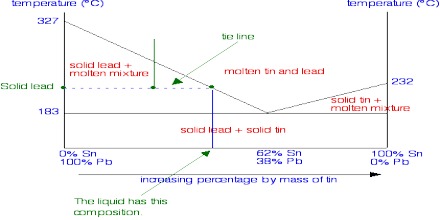
Fig: t-c diagram of two component system
In Figure, a phase diagram of a simple two component system is shown. A and B are two chemical species, whose melting points are denoted by a and b on the temperature axis. The two extreme ends on the composition axis represent 100% A and 100% B. Any point in between A and B has an intermediate composition (The composition axis is divided into, say, 100 equal parts so that the composition can be easily read off, e.g., the middle point represents 50% A and 50% B and so on). Such diagrams are known as temperature-composition diagrams or simply t-c diagrams and they constitute a very important and significant part of phase studies.
The important features of the diagram are:
(i) Curve aC along which solid A and liquid co-exist
(ii) Curve bC along which solid B and liquid co-exist
(iii) Zone above aCb where molten mixture of A and B are present
(iv) Area bounded by adC where solid A and liquid are present
(v) Area bounded by bcC where solid B and liquid are present
(vi) Area below dCe where sold A so solid B co-exist.
a is the freezing point of pure A. On adding a small quantity of B, the freezing point is lowered, say to a1, but the composition of the liquid mixture has also changed to c1. On further addition of B to the mixture the freezing point is still more depressed to a2 and the composition of the liquid becomes c2. This process will go on until A is saturated with B and the melting point composition curve follows the path ac1c2C. It may be noted that this is the curve indicating the solubility of B in A at different temperatures. Exactly similarly the melting point curve of B on addition of A will follow the path shown by bc3c4C and this is the curve showing solubility of A in B at different temperatures. All points on these two curves, therefore, represent liquid-solid equilibrium and the system is univariant (F = 2 – 2 + 1, condensed system). Or, in other words, if the temperature is changed the composition must change or the equilibrium will be disturbed.