The two components form a compound: Solid-liquid Equilibria
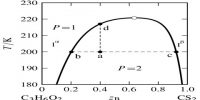
If the two components, A and B, chemically interact forming a compound, the phase diagram assumes a general form as shown in Figure. Here, ‘a’ is the melting point of A, b that of B. The whole diagram can be easily divided into two separate sections as shown by the dotted line. The section aAfe resembles the phase diagram shown in Figure 1. The only difference is in the existence of a compound of A and B, say AB. Similar is the case with the section efBb. This would be clear from the following discussion.
The freezing point of A is depressed along ‘ac’ on addition of a small amount of B to the liquid. On further addition of ‘B’ to the mixture solid ‘A’ separates and the depression of freezing point of ‘A’ and separation of solid ‘A’ continues until the composition reaches the value corresponding to the point ‘c’. At this point compound ‘AB’ starts to separate out. The point ‘c’ is an eutectic point where solid ‘A’, solid ‘AB’ and liquid co-exist. The composition of the mixture corresponding to the point ‘e’ gives the composition of the compound ‘AB’. If the addition of ‘B’ is continued the freezing point rises. Now we are considering the freezing point of the compound ‘AB’. The rise continues along the curve ‘ce’ until the point ‘e’ is reached.
Again when ‘A’ is added to liquid ‘B’ in small amounts the freezing point of ‘B’ is depressed. On further additions of ‘A’ the freezing point follows the curve ‘bd’ and solid B continues to separate out until the composition reaches that at the eutectic mixture corresponding to d. At this point compound ‘AB’ also separates outs‘d’ being the point where solid ‘B’, solid ‘AB’ and liquid co-exist. Here‘d’ is also a eutectic point. On further addition of ‘B’ the freezing point ‘AB’ continues to rise and follows the curve ‘de’ to reach the point ‘e’. This point is reached starting from either addition of ‘B’ at ‘a’ or of ‘A’ at ‘b’. The composition corresponding to this point is the composition of the compound ‘AB’. The whole diagram is now divided into various areas, like, ‘agc’, ‘che’, ‘ekd’, and ‘dbl’. Above the bounding curve a-c-e-d-b only the liquid exists. Within the area shown above there are
solutions and solids depending on which area is being considered. The various phases in all the areas have been clearly indicated in the diagram. Below the line g-c-h and left of line h-f eutectic mixture of ‘AB’ and ‘A’ is present whereas within k-h-f-B eutectic mixture of ‘AB’ and ‘B’ is present. In these eutectic mixtures one of the pure phases is the compound ‘AB’ formed from ‘A’ and ‘B’. This is possible due to the formation of ‘AB’. The four zones contain a liquid phase but the solid phases are from left to right ‘A’-‘AB’-‘AB’ and ‘B’.
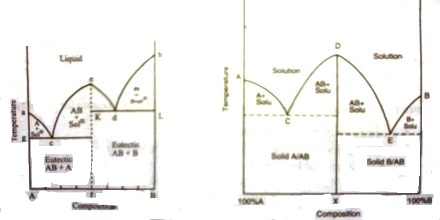
Fig 1: t-c diagram; fig 2: t-c diagram
The t – c diagram in Figure 1 may be obtained by joining the two diagram — one for ‘A’ and ‘AB’ and the other for ‘AB’ and ‘B’ as shown in Figure 2.
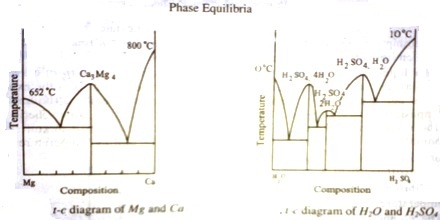
The presence of a maximum in the solubility curve as shown by ‘e’ is indicative of the formation of a compound between the two components. This point is termed as dystectic in contradiction to eutectic. The composition of the compound can easily be read off on the composition axis at the point f. Thus not only the compound formation can be detected but its composition can be determined. Compound formation between metals or between salts or between organic compounds is frequently studied with the help of phase diagrams. Aqueous solutions from which hydrates are formed constitute a large section of phase rule study. Many such compounds are known and they can be easily separated from the pure components and the eutectics by judicious choice of working temperature and composition. A phase diagram of ‘Mg’ and ‘Ca’ is shown in Figure 3.
If there are n dyslectics in the phase diagram, there are ‘n’ compounds; each maximum corresponding to one compound. Several systems with more than one compound formation are known. They are numerous in aqueous solutions of salts and binary metal systems. One such case is shown in figure -4, where the formation of three hydrates of H2SO4. Phase diagram thus may give clear answers to problems which otherwise difficult to answer.