A curve showing variation of volume of a substance taken along the X-axis and the variation of pressure taken along Y-axis is called an indicator diagram or P-V diagram. The shape of the indicator diagram shall depend on the nature of the thermodynamical process the system undergoes.
Let consider one mole of an ideal gas enclosed in a cylinder fitted with a perfectly frictionless piston. Let P1, V1 and T be the initial state of the gas. If dV is an infinitesimally small increase in volume of the gas during which the pressure P is assumed to be constant, then small amount of workdone by the gas is, dW = PdV
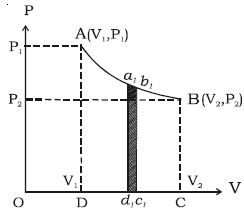
In the indicator diagram, dW = area a1b1c1d1
The total workdone by the gas during expansion from V1 to V2 is
W = v2∫v1 PdV = area ABCD, in the indicator diagram.
Hence, in an indicator diagram the area under the curve represents the work done (Figure).